Will this be a September to Remember?
Why the market goes up in some months and down during others is anyone’s guess. Sometimes it is related to tax planning, other times it appears random. Nevertheless, seasonality can become a self-fulling prophecy because so many investors trade based on historical patterns. For that reason, it’s important to be aware of historical patterns in case a repositioning in your portfolio is required.
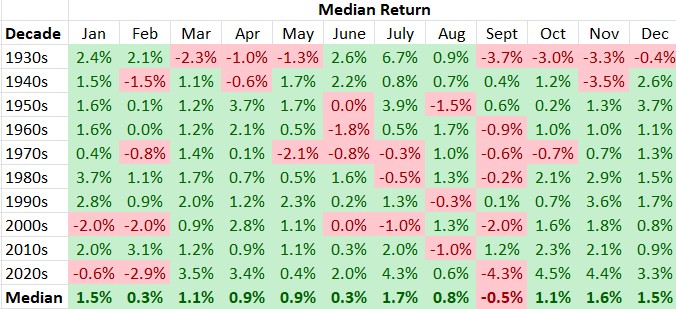
Going back to 1930, our research suggests that some months of the year perform much better than others.

There are two observations we draw from our research.
First, you want to be a long-term investor in the market. Over time, stock prices appreciate – albeit not every month – and the market goes up in value much more often than it declines. Actually, the S&P 500 has posted a positive price return in 68% of the years since 1930 (excluding the 1930s, that figure jumps to over 72%).
Second, September is historically a weak month. In fact, it’s the worst performing month with a -0.5% median price return since 1930. About 55% of the September’s over the last 93 years have produced a negative price return.
It is tempting to look at that chart and feel the urge to raise cash in your portfolio by selling stocks ahead of a correction.
However, when looking closer at the data, the better reaction is to resist that temptation and use any weakness as an opportunity to buy good companies on sale.
Sure, the majority of September’s have posted weak performance, but 55% is hardly overwhelming. Many companies declare dividends in September, which won’t be earned if you sell your stocks. For example, if a stock accompanies a 4% dividend yield and pays its dividend quarterly, you may save 0.5% in a capital loss foregone but you would have also walked away from a quarter of that 4% dividend yield.
Year-to-date, the S&P 500 is up almost 17% due to a select seven stocks with an artificial intelligence focus (see our July 31 “Time for the Magnificent Seven to Share the Spotlight” blog/webcast).
When looking closer at the numbers, we also discovered that since 1930, the market was positive 51% of the time in September provided the S&P 500 posted a positive return in the preceding eight months of the year from January through August.
Furthermore, if the market was up by more than 10% in the first eight months of the year (which was the case 34% of the time since 1930), the S&P 500 posted a positive return in September 63% of the time.
But, if September proves to be a poor month, history also suggests that the market bottoms in September and then heads upward. That would clearly conclude that weakness in September should be used as a buying opportunity for future capital gains.
If history is a guide, because the S&P 500 is positive year-to-date, it is more likely than not that September will be a positive month.
DISCLAIMER: Unless otherwise noted, all publications have been written by a registered Advising Representative and reviewed and approved by a person different than its preparer. The opinions expressed in this publication are for general informational purposes only and are not intended to represent specific advice. Any securities discussed are presumed to be owned by clients of Schneider & Pollock Management Inc. and directly by its management. The views reflected in this publication are subject to change at any time without notice. Every effort has been made to ensure that the material in this publication is accurate at the time of its posting. However, Schneider & Pollock Wealth Management Inc. will not be held liable under any circumstances to you or any other person for loss or damages caused by reliance of information contained in this publication. You should not use this publication to make any financial decisions and should seek professional advice from someone who is legally authorized to provide investment advice after making an informed suitability assessment.
